Mango Animation provides various kinds of charts for users to clearly and directly present their data. Specific steps are as follows.
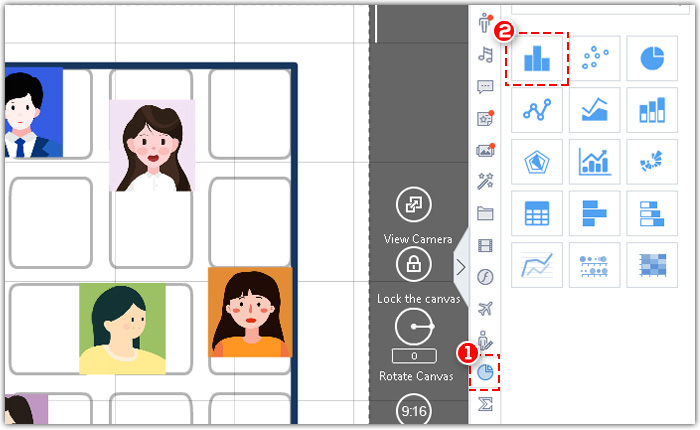
Step1. Click the “Chart” tab on the right-side toolbar>select one chart.
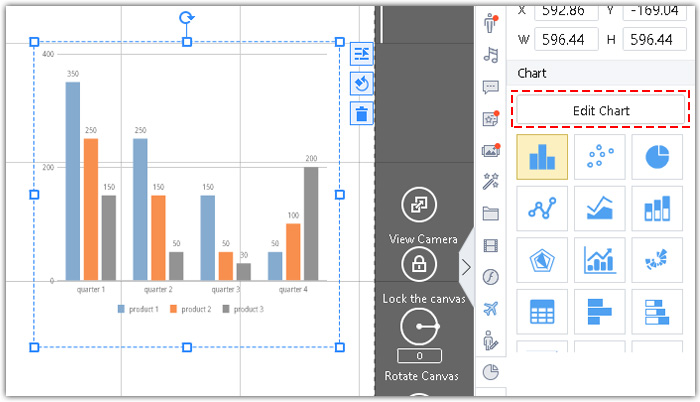
Step2. Select the chart on the canvas>click “Edict Chart”. There are many parameters that you can customize according to your need.
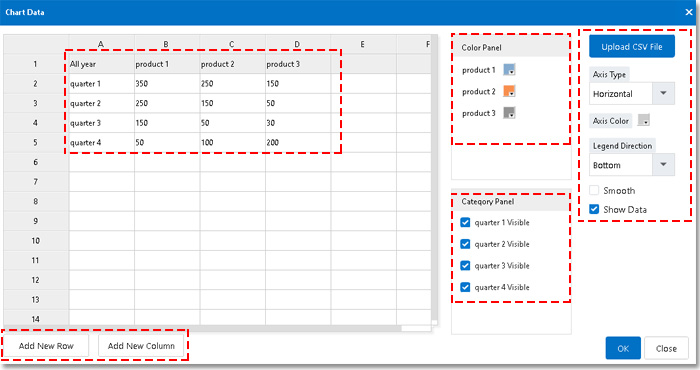
1. Edit the content of the chart.
2. Change the color of the chart.
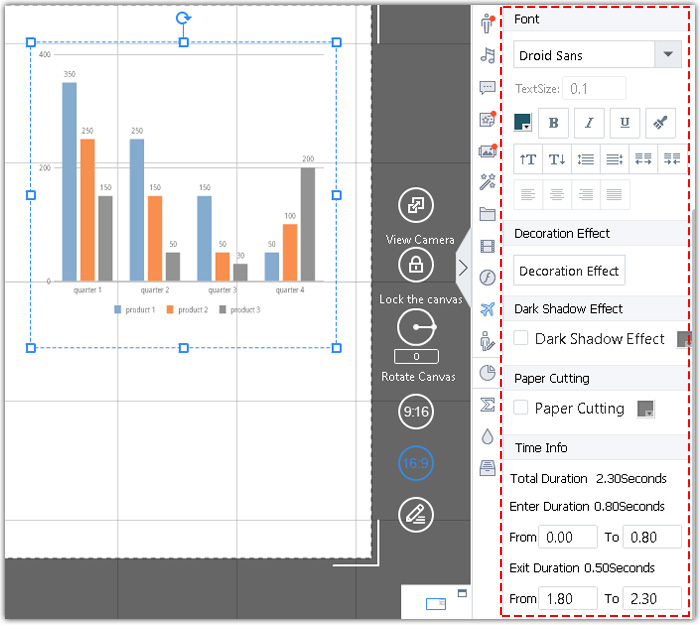
3. Change the font.
4. Click “Upload CSV File” then you can directly upload a CSV file from your device.
Step3. Customize advanced setting. You can edit the layout setting, such as the color, the font, the opacity and so on.